Note
Go to the end to download the full example code.
Running benchmarks manually#
While pyquickbench.run_benchmark() can be very useful to programatically run benchmarks, there are cases where it is either too difficult, or even impossible. This mostyl happens when the measurement involves some kind of manual action from the user. In this case, pyquickbench can still be used to organize and plot the results.
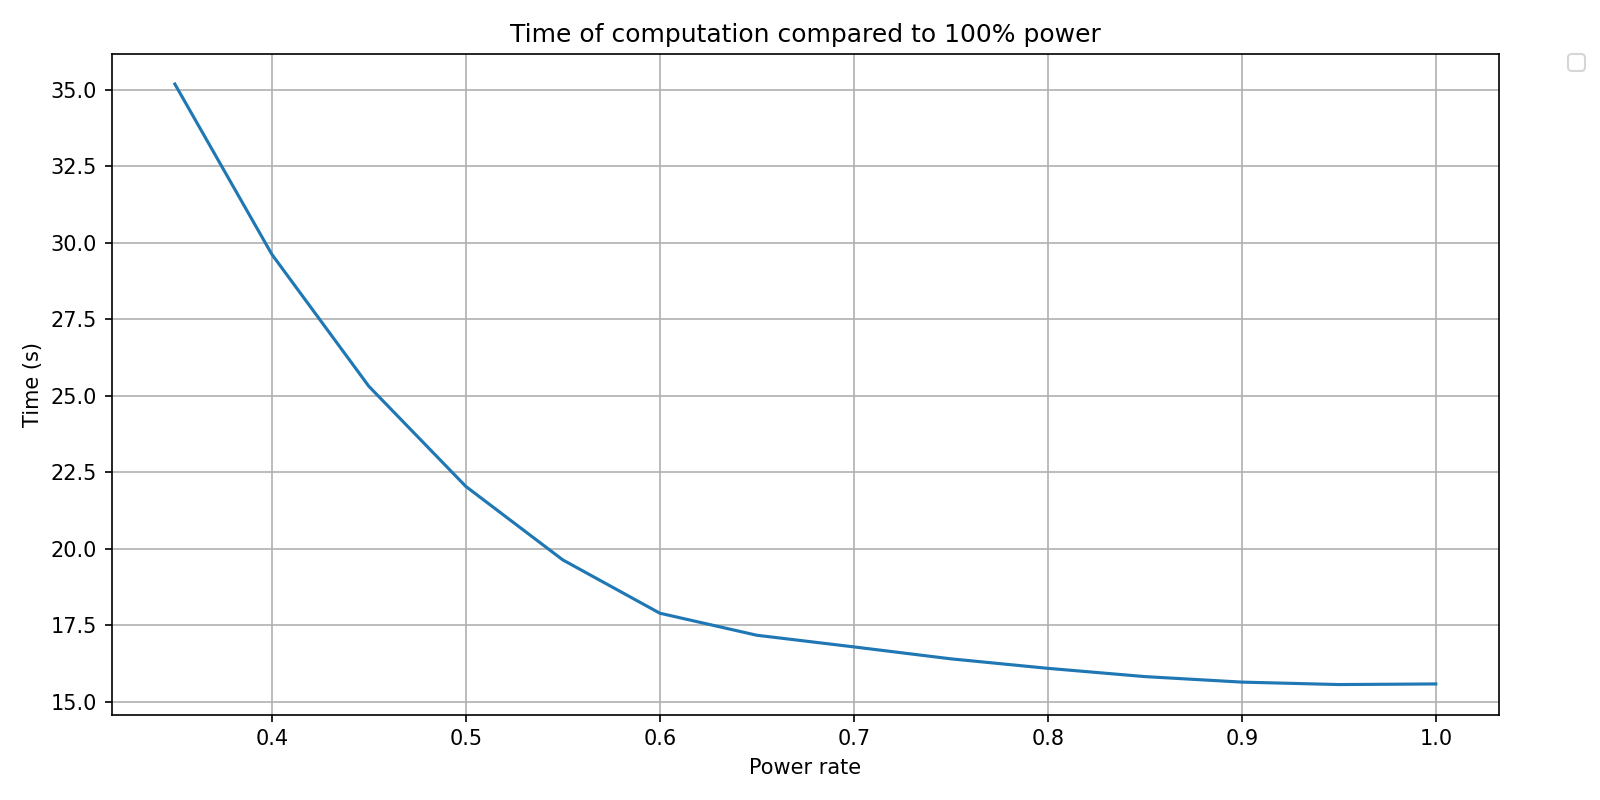
In the the following benchmark, the user manually ran a particular AI workload for varying maximal power settings of their GPU from 100% down to 35% in increments of 5%. Each run was repeated 4 times, and the results were measured as follows:
all_args = {
    'power_rate' : [1.00, 0.95, 0.90, 0.85, 0.80, 0.75, 0.70, 0.65, 0.60, 0.55, 0.50, 0.45, 0.40, 0.35]
}

timings_results_manual = [
    [ 17.00, 16.04, 15.85, 16.09, 16.65, 16.79, 17.24, 17.47, 17.99, 19.98, 22.25, 25.33, 30.28, 35.96],
    [ 15.88, 15.59, 15.70, 15.84, 16.11, 16.43, 16.87, 17.18, 17.97, 19.88, 22.31, 25.38, 29.62, 36.12],
    [ 15.67, 15.57, 15.68, 15.83, 16.10, 16.41, 16.82, 17.35, 17.92, 19.65, 22.06, 25.56, 29.67, 35.18],
    [ 15.59, 15.57, 15.65, 15.84, 16.24, 16.55, 16.80, 17.33, 17.90, 19.64, 22.04, 25.31, 29.62, 35.67],
]
In order to understand the format required by pyquickbench as its input, let’s create a mockup benchmark with similar settings, and run it with the option return_array_descriptor = True.
import numpy as np
import pyquickbench

def timer_fun(power_rate):
    pass

n_repeat = 4

all_args = {
    'power_rate' : [1.00, 0.95, 0.90, 0.85, 0.80, 0.75, 0.70, 0.65, 0.60, 0.55, 0.50, 0.45, 0.40, 0.35]
}

array_descriptor = pyquickbench.run_benchmark(
    all_args                        ,
    [timer_fun]                     ,
    n_repeat = n_repeat             ,
    return_array_descriptor = True  ,
)
The result of this call is a dict containing the description of the shape of the expected array of results. The order of entries is the same as the order of the axes (remember that dict are ordered since Python 3.7), the keys are their names, and their values are their sizes.
print(f'{type(array_descriptor)=}')
print(array_descriptor)
type(array_descriptor)=<class 'dict'>
{'power_rate': 14, 'function': 1, 'repeat': 4, 'out': 1}
print(f'{np.array(timings_results_manual).shape=}')
np.array(timings_results_manual).shape=(4, 14)
Formatting the user data as as simple as swapping axes and reshaping.
timings_results_pyquickbench = np.array(timings_results_manual).T.reshape([d for (k,d) in array_descriptor.items()])
The resulting array can then be used as an input to pyquickbench.plot_benchmark().
plot_intent = {
    'power_rate' : 'points'  ,
    'repeat' : 'reduction_min',
}

pyquickbench.plot_benchmark(
    timings_results_pyquickbench        ,
    all_args                            ,
    [timer_fun]                         ,
    logx_plot = False                   ,
    logy_plot = False                   ,
    plot_intent = plot_intent           ,
    title = 'Time of computation compared to 100% power' ,
    xlabel = "Power rate"               ,
    ylabel = "Time (s)"                 ,
    show = True                         ,
)
plot_intent = {
'power_rate' : 'points' ,
'repeat' : 'reduction_max',
}
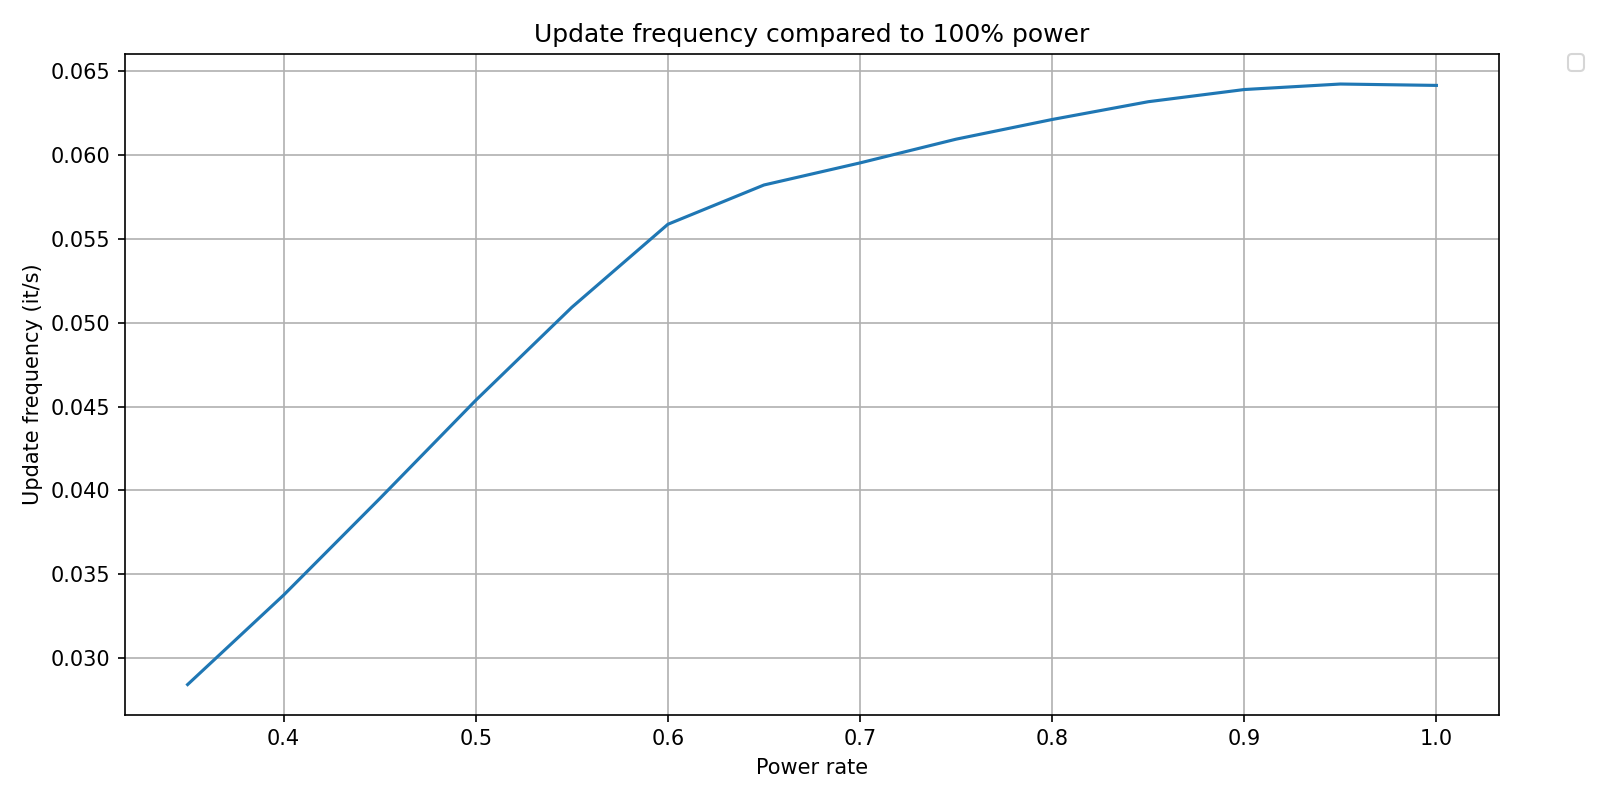
freq_results = 1./timings_results_pyquickbench
pyquickbench.plot_benchmark(
freq_results ,
all_args ,
[timer_fun] ,
logx_plot = False ,
logy_plot = False ,
plot_intent = plot_intent ,
title = 'Update frequency compared to 100% power' ,
xlabel = "Power rate" ,
ylabel = "Update frequency (it/s)" ,
show = True ,
)
- The plots above show that :
Speed is an increasing function of power consumption as expected
Growth is quickest for low power rates, wit an inflexion point at ~60% and a threshold near 90%.
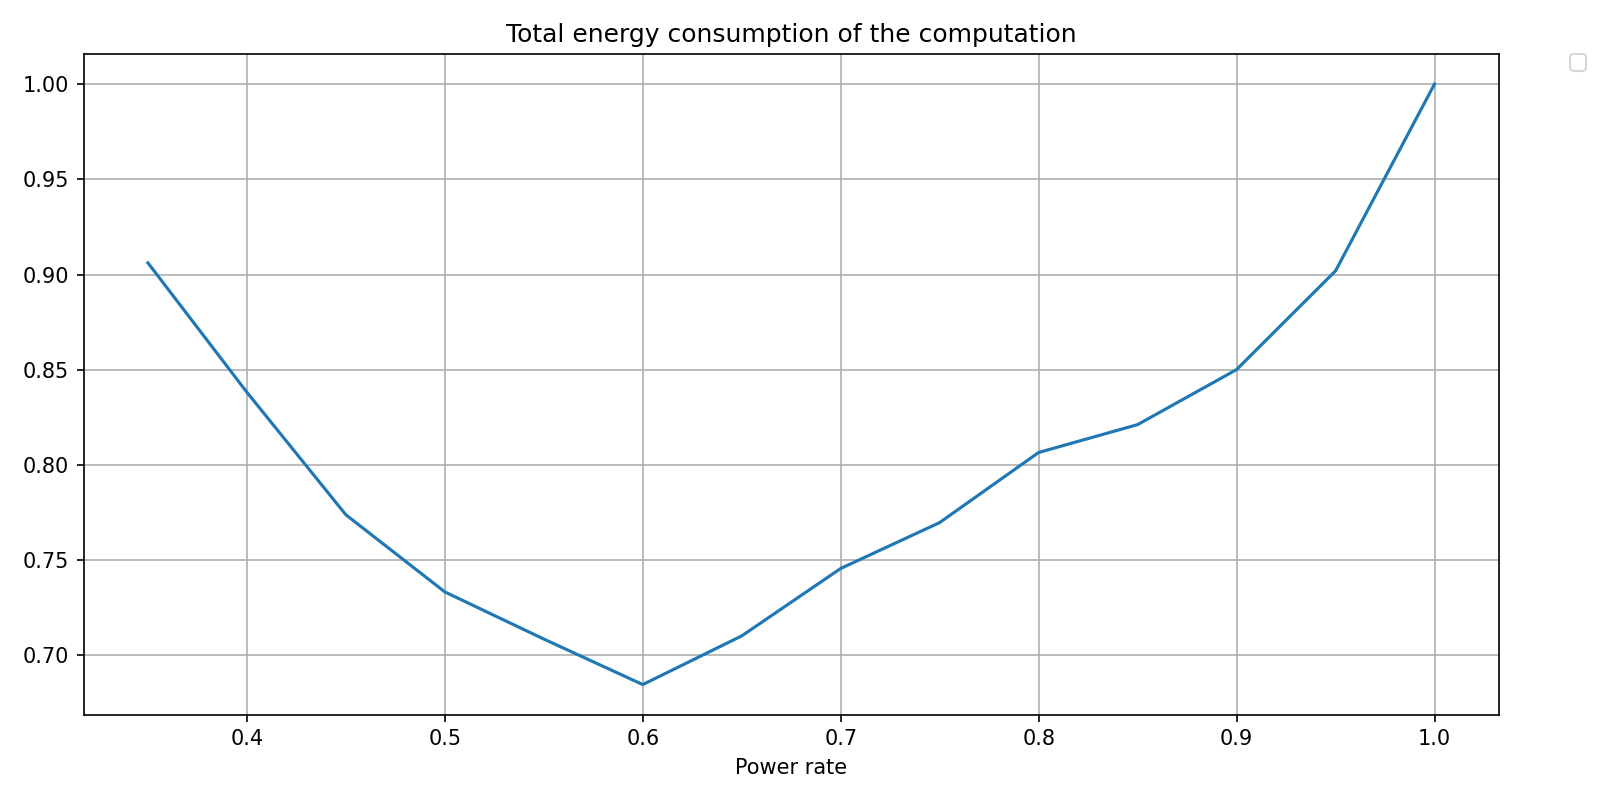
From this information, and using an estimation of the baseline power of the rest of the system can be inferred a power rate setting for minimum energy consumption. This estimate lies around 60% max power.
max_pow = 450
baseline_pow = 60

energy = np.empty_like(timings_results_pyquickbench)
for i, pwr_rate in enumerate(all_args['power_rate']):
    energy[i,...] = (pwr_rate * max_pow + baseline_pow) * timings_results_pyquickbench[i,...]

pyquickbench.plot_benchmark(
    energy                              ,
    all_args                            ,
    [timer_fun]                         ,
    logx_plot = False                   ,
    logy_plot = False                   ,
    plot_intent = plot_intent           ,
    title = 'Total energy consumption of the computation' ,
    xlabel = "Power rate"               ,
    relative_to_val = {'power_rate': 1.},
    show = True                         ,
)